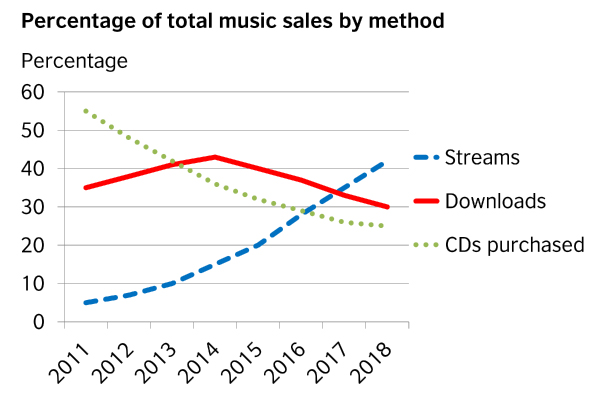
Trong phần đề bài của IELTS Writing, đặc biệt là dạng Line Graph có yêu cầu “Summarise the information by selecting and reporting the main features, and make comparisons where relevant”, vì vậy việc so sánh giữa các đối tượng, các số liệu là điều cần thiết. Với bài viết ngày hôm nay, HA Centre giới thiệu các bạn một số cấu trúc so sánh dùng trong IELTS Writing task 1 trong dạng Line Graph, mời các bạn tham khảo.

Dạng Line Graph – Một số cấu trúc so sánh thường dùng
| Structure | Example |
| X + experienced / witnessed + the greatest changes in something | London experienced by far the greatest changes in food prices over the period. |
| Both P and Q rate rose / fell + time, but the figures for P were significantly higher. | Unemployment rates in both countries rose over the period shown, but the figures for the US were significantly higher. |
| The most + adj + N was seen in the X sector. | The most dramatic decrease was seen in the industrial sector. |
| The biggest change was seen in …, which fell/rose + adv over the period. | The biggest change was seen in the proportion of Internet users in the US, which fell steadily over the period. |
| A much larger percentage / proportion of S + V …. in comparison with Y | A much larger proportion of students chose portable MP3 player in comparison with adults and senior citizens. |
| The percentage of X was highest in … | Of the three categories, the percentage of Internet users was highest in the US. |
| There were more X than Y + Ving, figure A versus figure B. | In 2003, there were more boys than girls suffering obesity, over 700 thousand versus about 650 thousand. |
| In a similar trend, S + also + V. | In a similar trend, the rate of growth also increased for Vietnam’s GDP. |
| The X rate rose / increased by …, but there was a much smaller rise/increase in Y. | From 1990 to 200, the employment rate in Yemen rose by 40%, but there was a much smaller rise in the figure for Italy. |
| Almost a% of S + V, compared to about b% of S2 and only c% of S3 | Almost 80% of Canadians used the Internet over the period, compared to about 60% of Americans and only 50% of Mexicans. |
| The figures for A and B were lower, at about x% and y% respectively. | The figures for oil and gas were much lower, at about 12% and 8% respectively. |
Rất mong bài viết này sẽ giúp bạn có thêm thông tin hữu ích, tham khảo thêm đầy đủ các cấu trúc so sánh trong IELTS task 1 để ôn luyện thật tốt nhé! Nếu bạn còn thắc mắc hoặc có nhu cầu học IELTS, hãy liên hệ ngay với HA Centre qua FORM bên dưới hoặc LINK TƯ VẤN miễn phí hoặc số điện thoại: Mr. Hà: 0963 07 2486 – HOTLINE 1: 032 796 3868 – HOTLINE 2: 032 976 3868 để được tư vấn kỹ hơn nhé!


