3 dạng tiêu biểu của IELTS Writing task 1 đó là Process, Line Graph và Pie Chart. Hôm nay HA CENTRE sẽ giới thiệu với các bạn bài mẫu IELTS Writing task 1 theo dạng tiêu biểu này nhé! Các bài mẫu mang tính chất tham khảo!
1. Bài mẫu Dạng Process
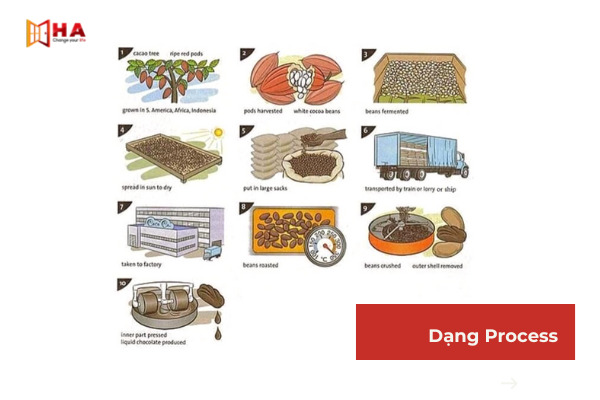
Bài mẫu Dạng Process
(Đề thi ngày 09/1/2021)
The diagram shows how chocolate is produced. Summarize the information by selecting and reporting the main features and make comparisons where relevant. Write at least 150 words.
The flowchart illustrates the steps in the process of chocolate production.
Overall, it is clear that there are ten distinct stages in this process, from the initial collection of pods from cacao trees to the eventual production of liquid chocolate.
First, cacao trees, which are cultivated in South America, Africa and Indonesia, bear ripe red pods. These pods are then harvested and the white cocoa beans inside them are extracted. After that, the beans undergo fermentation before being sun-dried in the next step.
At the fifth stage, the dried beans are put into large sacks, ready for the following step which is transportation by train, lorry or ship. Next, the sacks are taken to the factory, where the beans are roasted at a high temperature of 350 degrees. After roasting, the beans are then crushed and the outer shells are removed. Finally, the inner part of the beans is pressed, which makes the end product: liquid chocolate.
(157 words)
Vocabulary
– Cultivate (v): trồng
– Harvest (v): thu hoạch
– Extract (v): lấy ra, tách ra, chiết ra
– Undergo (v): trải qua
– Fermentation (n): sự lên men
– Sun-dried (adj): được phơi nắng
– The end product: sản phẩm cuối cùng
2. Bài mẫu dạng Line graph
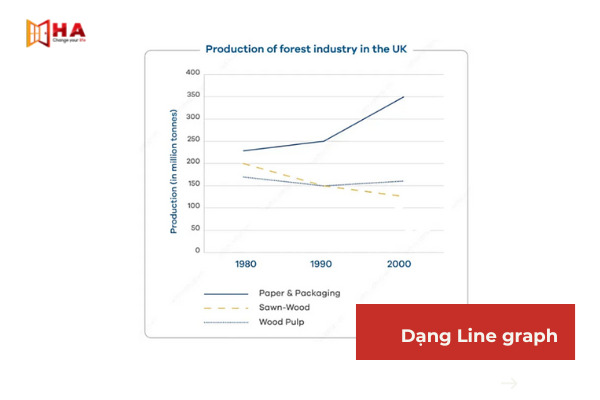
Bài mẫu dạng Line graph
(Đề thi ngày 27/01/2022)
The line graph below shows the production of paper, wood pulp and sawn-wood in the UK from 1980 to 2000.
The line graph shows data regarding the production of the forest-based industry in the UK between 1980 and 2000.
Overall, it is clear that the manufacture of paper and packaging saw continuous growth, standing at the highest position over the period shown. Also, there was a switch in the position of sawn-wood and wood pulp, with the former’s figure decreasing significantly and the latter’s remaining relatively unchanged.
In 1980, around 240 million tonnes of paper and packaging are manufactured in the UK, compared to 200 million tonnes of wood pulp and around 170 million tonnes of sawn-wood. After 10 years, the production of paper and packaging increased slightly to 250 million tonnes whereas the figures for the other two wood products dropped to the same point of 150 million tonnes.
In 2000, the amount of paper and packaging peaked at 350 million tonnes while sawn-wood underwent a continual drop in production to just over 125 million tonnes. In contrast, the production of wood pulp recovered and exceeded the figure for sawn-wood by roughly 30 million tonnes.
(176 words)
Vocabulary
– Manufacture (v/n): sản xuất/ sự sản xuất
– Growth (n): sự tăng trưởng
– The former : cái được nhắc đến trước (trong 2 cái)
– ><the latter: cái được nhắc đến sau ( trong 2 cái)
– Peak (v): đạt đỉnh
– Exceed (v): vượt qua
– Roughly (v): xấp xỉ
3. Bài mẫu dạng Pie chart
Bài mẫu dạng Pie chart
( Đề thi ngày 19/1/2021)
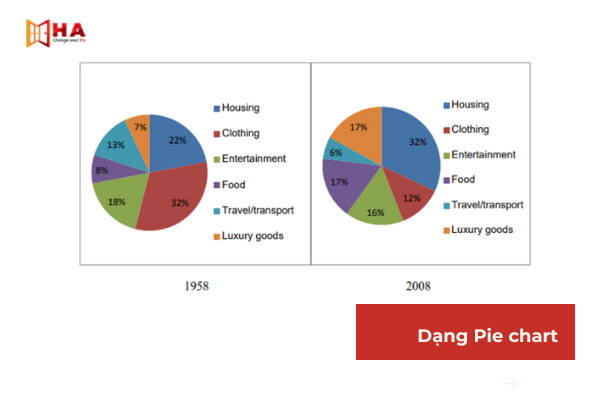
The charts below show the proportion of people’s spending on different commodities and services in a particular European country in 1958 and in 2008.
The pie charts compare the percentage of people’s expenditure on diferent goods and services in one European nation over two seperate years.
Overall, it is noticeable that the proportion of spending on housing, food and luxury goods increased in 2008 while the figures for clothing and travel/transport dropped.
In 1958, people spent 22% of their budget on housing costs, and this rose to 32% in 2008. The proportion spent on food increased significantly from 8% in 1958 to 17% in 2008. A similar growth was seen in expenditure on luxury goods from 7% to 17% in the same years.
On the other hand, the opposite trend was observed in the remaining commodities and services . To be specific, the percentage of total spending on clothing dramatically plunged from 32% to just 12% after fifty years. Likewise, the proportion spent of travel/transport fell by more than half and stood at 6% in 2008. Spending on entertainment, however, remained relatively stable, with a slight decrease from 18% in 1958 to 16% in 2008.
(170 words)
Vocabulary
– Expenditure (n) = spending: sự tiêu dùng
– Budget (n): ngân sách
– Noticeable (adj): đáng chú ý, dễ nhận thấy
– Plunge (v): giảm mạnh
– Likewise (adv) = in a similar way: tương tự như vậy
Trên đây là những bài mẫu IELTS Writing task 1 theo dạng tiêu biểu. Mọi thắc mắc vui lòng liên hệ ngay với HA Centre qua FORM bên dưới hoặc LINK TƯ VẤN miễn phí hoặc số điện thoại: Mr. Hà: 0963 07 2486 – HOTLINE 1: 032 796 3868 – HOTLINE 2: 032 976 3868 để được tư vấn kỹ hơn nhé!


